
Advanced Stats for Packers Fans 101: DVOA and Next Gen Stats
A look at two new advanced stats metrics: context-driven DVOA and the movement based Next Gen Stats

By Kalani Jones
 Hello everyone, and welcome back to Advanced Stats for Packers Fans 101. Last week we covered Success Rate and PFF, two topics that we acknowledged as being simple to understand, but somewhat flawed when viewed in a vacuum. Today we are going to move on to cover two more metrics, which are a bit more dynamic.
DVOA stands for Defense-adjusted Value Over Average (or Dorks Value Only Analytics, depending on your feelings) was first developed by Football Outsiders, and later moved to FTN Fantasy when the former went financially bankrupt and the website was essentially abandoned in 2023. The metric was developed as part of Football Outsiders’ partnership with FOXSports in the early 2000s, and has become a major part of any analytical conversation about the NFL.
Simply put, DVOA measures every down played and compares it against every other down played across the league, using an average based on down and distance (thus creating “situations”). It’s similar to the success rate metric we discussed last week, but instead of using a yardage-based pass or fail equation to judge those plays, instead compares them only to other plays and situations. For the purposes of analytics, both are superior to more conventional statistics, which tend to only value yardage per play. For example: player 1 rushes for 5 yards and player 2 rushes for 3 yards. The typical average would be 4, but DVOA provides an average for every single situation, and that’s where the metric comes in. The yards rushed is also calculated for 1st, 2nd, 3rd and 4th down. From the 39 yard line or the 1 yard line. It categorizes every single stat and provides an average. So if running back 1 is 10% over DVOA then they’re 10% better than the average. Same for 20% under DVOA where Player 2 is 20% worse than average.
Still with me? Good, we’ve got a ways to go.
As the name implies, the value of a play is measured on an average basis, and then adjusted based on the opposing defense. This is part of what sets DVOA apart from other metrics, in its ability to account for the greatest variable in football: the opposing team’s strength. To accomplish this, a defense’s ability to defend every situation is charted (remember, every single play across a season is measured in DVOA).
Next up, we have the system in which DVOA keeps track of these plays and compiles them into a score. This is referred to as “Success Points”, and they are assigned on a per-play basis. For normal plays, an unsuccessful play is given zero points, and a successful play is given one point, with fractions in between to account for variables. On offense, the points can go higher in the case of extra yardage (up to five points for 40+ yards) and touchdowns. Defensively, a team can earn bonus points for creating turnovers, or losing yards, both also accounting for the usual adjustments. This part of DVOA is massively complicated, but just know that every little detail is charted and accounted for. For passing plays, the position of the receiver is taken into account, meaning wide receivers, tight ends and running backs might have slightly different results on the same play. Offenses and defenses are counted differently when playing from behind late in the game, there’s even a difference depending on if the game is played indoors and outdoors.
After every play is assigned its point value, the play will be compared to other plays’ point value from the same down and distance across the league, which includes factors from location on the field, score lead or deficit, time remaining in game, ect. and assigned that % number. Just remember that if a DVOA is 10%, it is ten percent better than the average play. The inverse is true when attempting to chart a defense’s DVOA score, where an opposing offense is the one being compared against. So when viewing a chart of DVOA scores, you are looking for positive scores for offense and negative scores for defense, since the same “goal” is still being measured. Thus, in order to come up with a team’s “total” DVOA, you simply subtract a team’s (usually) negative defensive score from the team’s positive offensive score. There’s even more detail here, such as a special system for special teams DVOA, and how certain elements are counted for offense but not for defense.
DVOA is also, of course, tracked at an individual level and in a similar manner. The difference is that instead of the average being tracked being other teams, it is of course every player of the same position that is being compared against. With our beginning example of two running backs, we now know exactly why, if taken from the same situation, a run of 4 yards and 6 yards will produce different DVOAs. The major strength of DVOA is its ability to stack up teams and players and quickly find out how they fare in certain situations. Thus, it’s easy to see the strengths and weaknesses of the teams, what they can improve upon, and why.
So how do the Packers stack up against the rest of the league, using DVOA? Pretty damn good.
In 2024, the Packers massively improved their overall DVOA score, going from the 27th ranked DVOA team in the league all the way up the 4th, with a score of 30.2%. On offense, the team was again 4th, with 17.3%, and 7th in defensive DVOA with a -7%. Looking a bit deeper, the team’s offense dominated to third place scores in both passing and rushing DVOA (38.5% and 7.8% respectively). Defensively, they scored 9th in passing defense with a 0.4% and a -17.4% in rushing defense, which placed them 7th.
All that translates to good, steady, consistent high end play from the Packers over 2024, and it’s that consistency that is the difference from a strong team the Packers fielded in 2024, and the (i)much(i) lower ranked 2023 version, which unequivocally played at a higher peak towards the end of the year and into the playoffs.
No system is perfect and there are, of course, drawbacks to DVOA. When it comes to individual DVOA stats, it’s hard to really attribute these plays specifically (i)to(i) the player themselves. Football is the ultimate team sport, So for a running back to have a DVOA of say, 10%, you are ultimately still saying that the player, playing with their teammates, in this specific scheme, with this coach, with this quarterback, has a DVOA of 10%. It’s for this purpose that I prefer DVOA as a team-only stat. There’s also the problem of FTNFantasy really only being able to access what they are provided by the NFL play by play, or their own in-house data team at FTN Data, plus the speedy turn-around demanded in season. Thus, by their own admittance, FTN is unable to chart plays such as dropped passes, and incorporate them into the metric (certainly a problem when trying to evaluate a team like the Packers, who famously had trouble with that in 2024). There’s also the problem that the specifics of this data are locked behind a subscription package, similar to our discussion around PFF.
FTN also offers a variety of other metrics by which fans and media can use to evaluate teams, such as DAVE (Defense Adjusted for Variation Early, a way to still use DVOA early in the season when the averages are still skewed), DYAR (Defense-adjusted Yards over Replacement, a way to place more value on an individual’s value compared to a hypothetical league average replacement player), PGWE (Post Game Win Expectancy), and others.
To wrap up this section on DVOA, let’s take our example with two running backs, and instead say that they both rushed for three yards. We know that DVOA will chart these runs the same, (i) unless (i) the situation is different. If one is a 3rd and ten, and the other is 2nd and one, there’s an obvious difference. If both are from the third and ten, but one team is leading and the other is trailing, there will be a difference. If both are from the third and ten while leading, but there’s two minutes left in the fourth quarter, versus the first quarter…well, you know where this is going.
By automatically taking all of these situations into account, fans can be easily more informed of how exactly their team or favorite player stacks up against the average player, without the need to personally dig into exactly what the context around these plays were.
Whew, that was a lot, right? Let’s talk about something a little more fun.
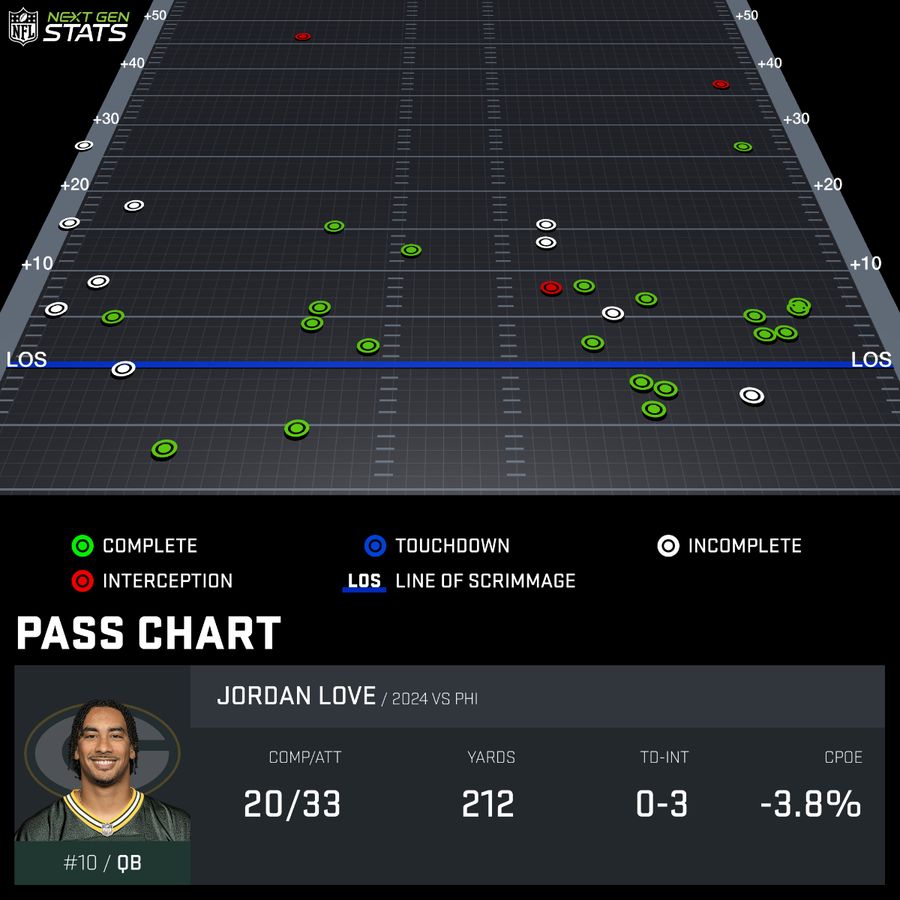
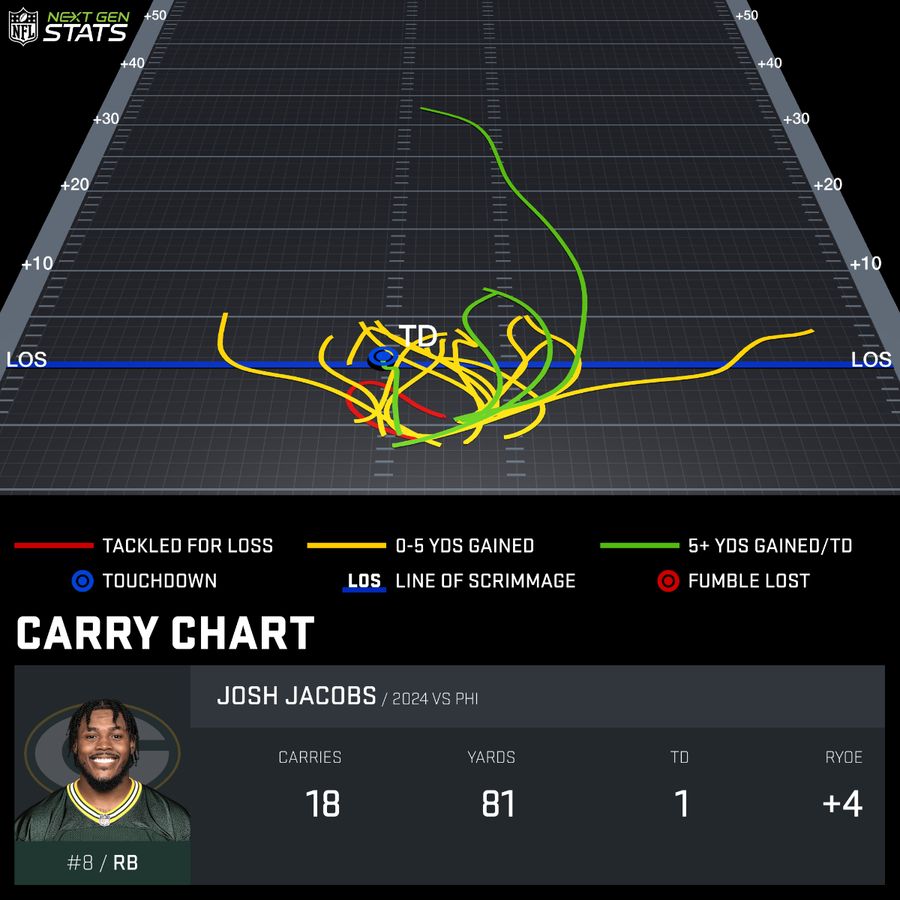
You’ve probably heard of Next Gen Stats (NGS). As the NFL’s own initiative, it’s gotten a lot of use, and is probably known by even the casual fan of the NFL. Amazon can put those numbers right on your screen on Thursday Night Football. Social media accounts are quick to blast out the week’s fastest ball carriers, longest throws, and catch probabilities. NGS was given life in 2011, when NFL players agreed to have their on-field location tracked during the collective bargaining agreement, but it wasn’t until 2014 that the league, in tandem with Zebra Technologies and the Amazon Web Service data infrastructure, really rolled out the service for the public. 2015 saw the rollout of “next-gen replay”, and a variety of new metrics were created in 2022 and in 2024, when machine-learning tools were integrated.
Using sensors in the player’s shoulder pads, the ball, and the first down marker, NGS uses a tracker system to keep real-time view of everything happening on the football field, and this is what allows NGS to create their own special brand of football tools and metrics.
Want a better look at Jordan Love’s wild card performance against the Eagles? NGS has that.
How about Josh Jacobs? He had a better game that day at least.
How about a different kind of view of that incredible Love to Reed pass against the Rams in week 5? Maybe featuring some player separation information? Yup. Wow, I wonder what the completion probability of that play was? 18.4%
NGS is a really fun tool for fans of all levels to interact with the game in a new way. The site also offers a number of their own advanced stats, based on player location instead of a math formula. For example, NGS tracks a “QB aggressiveness stat”, by tracking how often a quarterback throws at a receiver with one yard or less of separation (Jordan Love ranked ninth with 17.6%). 8+D% is a stat that tracks how often a running back will see eight plus defenders stacked up in the box against him, which Josh Jacobs saw around 20% of the time. For receivers, the SEP stat tracks a receiver’s average distance between them and the nearest defender at the time they get the ball (complete or incomplete). I’ll give you three guesses as to who led the Packers in this stat last year, but I don’t think you’d guess it. Tucker Kraft was the leader here, with 5.4.
Another great feature is the Game Center, which displays each team’s top performers in certain NGS metrics like fastest ball carrier, longest throw in air yards, and some interesting graphics on areas like passing zones, receiver separation and pass rush separation.
All in all, is there anything really to gain here, from a team or gameplanning perspective? No, probably not. NGS is certainly tailored to the individual player, but I do think it can provide a fairly coherent view of that player and their playstyle. The problem comes from trying to actually put that picture together. The site’s functionality is… not great. There’s no search function, no pages for individual players, and no way to view results beyond the top players. While you can view certain stats on a year to year and week to week basis, I’d still love to see some more filters and options. And of course, their version of stats are only available for quarterbacks, running backs and receivers (Wrs/Tes), and the only defensive metric available is a “fastest sack time.” I can only hope that NGS has some defensive metrics in the works, as I can only imagine how fun stats like average time to tackle, or cornerback separation stats could be.
As we look at our new knowledge of DVOA and NGS, what lessons can we take from the two analytical systems? In my mind, DVOA’s superpower is the impressive way that it is able to include the broader context of what is again, the ultimate team game. Every single play has so much work put in, and so many hands and minds have contributed to that result, and I appreciate that DVOA can at least begin to account for that. NGS is a technological marvel, but in an opposite way allows the user to cut through the noise and focus on a player’s performance.
Join me next week as excited to cover the king of modern football analytics: EPA.
PLEASE SUBSCRIBE TO OUR CHEESEHEAD NATION WEEKLY NEWSLETTER HERE.
__________________________
Co-Owner of the thirteen time world champion Green Bay Packers. Sometimes I write about them. Follow me on Twitter at https://x.com/kjones_in_co and on Substack for film breakdowns!
__________________________













Comments (5)
Coldworld
August 06, 2025 at 12:54 pm
A good, simple, explanation and summary. I do have a question on DVOA in aggregate that I have wondered before.
As I understand it, DVOA is team (opponent at the team and individual level) blind in judging a play. So it compares plays against, effectively a league wide aggregate. That has some merit when looking at individual plays. However, when looked at over a season I do wonder how much (actual) strength of schedule skews comparatives. For example, the Packers had a relatively weak schedule and played a few teams missing key pieces on that particular day.
That’s football of course: no complaint, but it might be a factor in our surprisingly high DVOA season ranking? The Packers last year weren’t as effective as that suggests. Elements were (FoR example Jacobs and Wilson’s yards after contact), but that in itself suggests issues other issues (on the OL penetration with respect to RB my yards after contact example). Presumably those should balance out on a team level?
Kalani Jones
August 06, 2025 at 01:20 pm
That’s a great question, and definitely something I could have expanded upon further. The answer is that DVOA is not 100% team blind when it reviews every play.
While every play is ultimately judged against the league average, there are small adjustments made to it as well that attempts to account for intangible details, such as how I mentioned things like time left on the clock and the game being played indoors/outdoors. That part of the formula also accounts for strength of opponent.
The formula will give more points for strong play against a weak opponent, but not as much as strong plays against a strong opponent. The same idea applies to defense as well.
Coldworld
August 06, 2025 at 05:11 pm
Interesting. Thanks for the clarification.
Leatherhead
August 06, 2025 at 06:30 pm
DVOA is pretty interesting. Footballoutsiders had that about 25 years ago and then I kind of lost track of it for a few years.
I think DVOA is one of the better measures out there. It's a helluva lot better than PFFs various pieces of statistical minutiae.
davekenya
August 09, 2025 at 09:56 pm
I've often wondered how to more accurately assess the our kickers relative to other kickers (both punting and FGs). Rather than simply saying 'it's harder to make kicks outdoors and in the Wisconsin winters, thus GB's FG % is lower than kickers who kick primarily indoors' -- which is a true statement -- that a more accurate gauge would be kicker vs. kicker %s kicking in the same game (under the same conditions). Then...what kickers shake out as 'better' at making FGs? Is this captured in the analytics?