
Advanced Stats for Packers Fans 101: Success Rate & PFF Scores
Before the season starts, a quick run through of advanced stat concepts.

By Kalani Jones

The long wait is finally over: the Packers are back in Green Bay and they’ll be playing football until (hopefully) February. As the team begins to form its identity, build chemistry, and build towards that pivotal matchup with the Detroit Lions on September 7th, there’s not much for us fans to do. Sure, we can (and do) stay glued to the internet for every scrap of news tweeted out by those in attendance, but again, there’s not much that we can (i) do (i) with those scraps. Pads come on only this week, and joint practices / preseason games can only do so much to scratch the itch of real football. Instead, what I’ll be doing for the next several weeks is preparing for the season by helping you all become more familiar with an increasingly large part of the game of football: advanced stats. From EPA, to DVOA, to Pro Football Focus and everything in between, these names have become such a large part of the game that it’s no longer a surprise to hear them cited by GMs and head coaches as a not insignificant part of NFL gameplanning.
What I’ll not be doing is providing a case for why advanced statistical metrics should be the end all, be all of evaluating football, because they shouldn’t be. These tools are just that: tools. I leave it to the individual to determine exactly how much stock to put into these ideas, and how much to leave up to the good ol’ eye test. Over the next few weeks I’ll be exploring the idea behind, and the efficacy of, some of the most popular of these stats, how to find them, and how they relate to the Green Bay Packers. Today I’ll be going over two concepts: the easiest to understand in Success Rate, and perhaps the most controversial: the PFF grading system.
Success rate is extremely easy to understand, and football fans should be able to recognize its value right away. Simply put, it measures whether a team’s offense can efficiently gain yards. In order to be recorded as a successful play, you need six yards on first down, half the yards remaining on second down, and all the remaining yards on third (or fourth) down. That’s it.
Okay, there’s a bit more nuance than that. Let’s break it down.
According to the textbook definition of the stat, on first down a team needs to gain 60% of yards needed for a first down. This is usually six yards of course, but following a holding penalty for example which results in a 1st and 20, the offense would need twelve yards to stay on track, and thus earn a successful play. On second down it looks for 50% of yards needed. So on a standard set of downs, if the offense had a successful play on first, leading to a 2nd and 4, they would need only a two yard gain to receive a successful play. However, say the offense suffered a sack on first down and is now staring at a 2nd and 18, they’d now need nine yards to meet the metrics criteria. On third and fourth down, you just need to do the deed. Get a first down (or touchdown) and you’ve got yourself a successful play. Defensive success rate is also tracked, and is simply the inverse of the offensive formula. Preventing 60%, then 50%, then 100% of yards gained is the goal.
All that might seem quite obvious as the underlying goal of all football plays, and that’s because it is. There’s no reinventing the wheel happening here, and that’s why success rate is the perfect launching point for a look into advanced stats. There’s no secret mathematical formula and no subjective views. Nothing but cold, hard yardage and first downs, baby. There is, however, a particular use case for success rate amongst football fans and analysts, and that is as a superior form of the more common “yards per play”. The context of down and distance applied to success rate is a valuable insight into the actual story of the play.
Say for instance, on third and 25, a quarterback is forced to resort to a short check-down throw to his running back, who miraculously manages to juke and stiff arm his way to a twenty yard gain. While that play will look impressive in the box score after the game, because he didn’t gain the first down it cannot be counted as a “successful” play, according to the metric. It’s for this added layer of context that I find myself referring to success rate quite often as a football writer, especially when scouting for an upcoming team or player (success rate is also tracked at an individual level among quarterbacks). The stat can be most easily found via the team at https://sumersports.com/, and the site also allows you to refine your search to situations like non-garbage time, while leading or trailing, or even take snap counts in consideration for quarterbacks.
So what can this tool tell us about the Packers? Let’s take a look at where they stacked up in 2024. Matt Lafleur's offense ended the year ranked 13th in success play rate at 44.4%, just ahead of the champion Philadelphia Eagles, while the defense surprisingly ended the year as 21st in this metric. Jordan Love was the 16th ranked quarterback (with a snap count minimum of 100), a slight fall from his 14th rank in 2023. We can use the site’s refinement feature to do a bit of digging however, and find that he was a top ten quarterback here when blitzed and on early downs, but fell on late downs. For those curious, Malik Willis was also included, and came in as the 46th ranked quarterback in this metric.
So when we look at those numbers, what can we tell? Not much, which is the major drawback to success rate, and why it works best when looked in conjunction with other stats like EPA, is that it fails to recognize the “magnitude” of a play. Six yard pass on first down? Successful play. Sixty yard pass on first down? Successful play as well, and counted just the same as the first example. Having the additional knowledge that the Packers offense and Jordan Love were ranked quite highly among other offensive stats, combined with their success rate, could tell an observer that the Packers were a boom-or-bust offense, often looking for big explosive plays, and getting them too at an acceptable level.
Does that all make sense? Great, now let’s do a 180, and introduce PFF.
Pro Football Focus (or just PFF) is perhaps the antithesis to this quick to understand, yes or no idea that is success rate. As a concept, PFF’s most meaningful impact on the game of football is their player grading system, basically an attempt to reduce a player or team’s performance to a single number or “grade”. This grade is done on a 0-100 scale, with a “60” marking an average performance.
To do this, PFF employs analysts that watch every snap of a player’s performance in a game, and uses a scale to provide that player with a plus or minus score. The end of game score is converted into the 0-100 scale, at the game and season long level. According to their site, there are multitudes of data collected on every play that impact that score, likely to avoid the implication that players are graded on a subjective basis, but that’s only one of the many concerns that can be expressed about the PFF system, including not knowing the play being called, the experience of the graders themselves, and the system behind the scores itself. I’m not here to answer every single one of the questions on behalf of PFF, but it’s worth acknowledging that the company does not shy away from answering those questions, and their answers can be found. Of course, the most significant drawback to PFF in regards to the average fan is that their work is only available to those with a PFF subscription.
Having gotten a first hand peek behind that PFF’s curtain, I can report that the people I’ve met there are some of the smartest and most passionate in the industry. On a personal basis, I do trust their process, but even if you don’t (and that’s okay!), I think it’s obvious that their system of grading every player on every snap will, if nothing else, expose whether or not a player shows (b) consistency (b) in their play. Consistency is also a stated emphasis in their metric, shown through how they create their season long grades. These numbers are not just an average of total games played. For example, a player who would receive an 80 grade every game of the season would not just receive an 80 for the year, but because that impressive high-end consistency is so highly regarded, the final grade would actually rise higher.
PFF also does a magnificent job in their own signature advanced stats metrics, even beyond the player / team grades, including their WAR stat (Wins Above Replacement), Turnover Worthy plays, and Elusive rating. There’s also some things to appreciate about the way they gather stats, even more “normal” ones. Just to give one example, if two players sack a quarterback at the same time standard statistics would register that play as a half sack for each, while PFF simply rewards both players with a full sack.
In regards to the Packers, PFF had them ranked as the sixteenth overall graded team, tenth in offense and thirteenth in defense, while also receiving top five grades in more specific areas: coverage, tackling, run offense and pass blocking. Jordan Love was their seventeenth ranked quarterback, while Josh Jacobs was ranked fourth in rushing grade, and Xavier McKinney was their third highest ranked player in coverage grade.
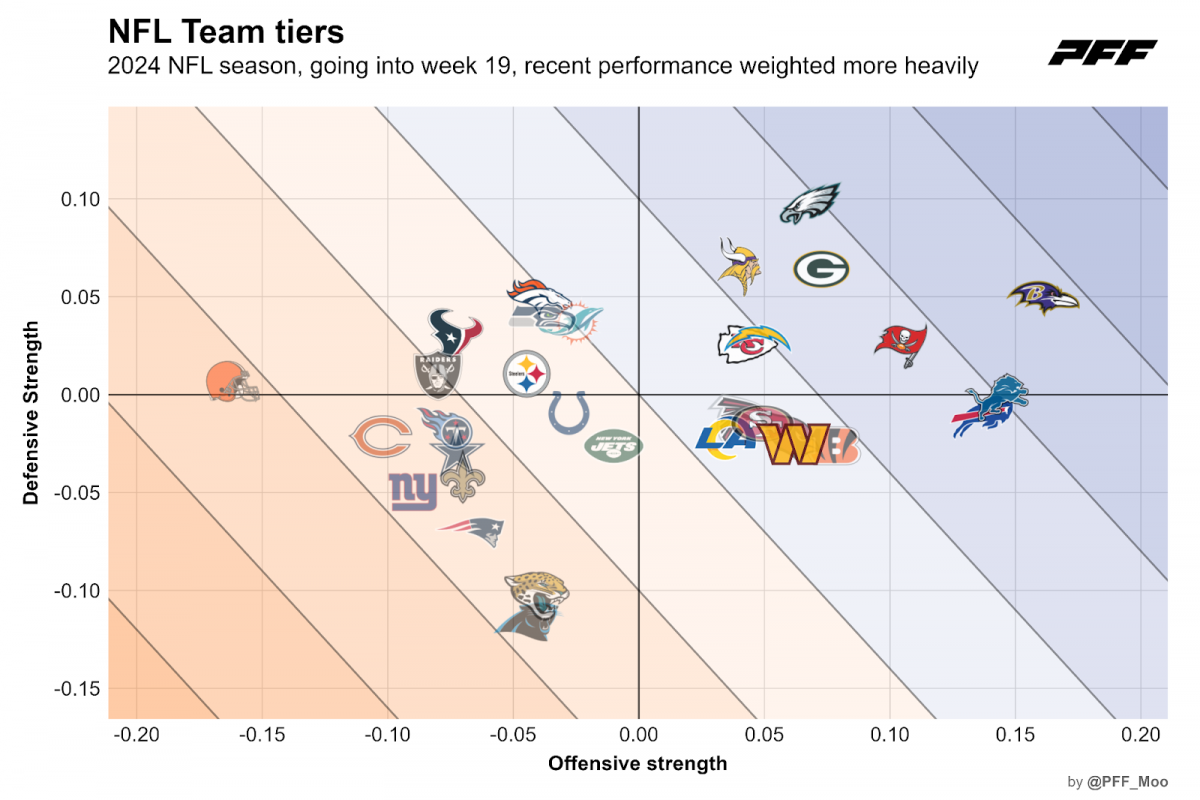
As I mentioned at the top of the article, PFF is perhaps the most controversial topic in advanced stats today, mostly due to the human factor that is entered into the equation there. However, if you are someone who is curious about the numbers side of the game of football, PFF is a premium asset to have in your pocket. If you are also a college football person, the exact same metrics, advanced stats and grades are also given out to college football, providing valuable insight during the draft process.
Both success rate and PFF share a certain simplicity. Success rate is a quick, easy to understand percentage, while PFF manages to provide users with a single number to summarize a player’s performance. Both of these concepts are best used in conjunction with other advanced stats. In regards to success rate, it is most commonly associated with EPA (there’s even a version of success rate that counts any play with a positive EPA as a successful one), while PFF player grades should be viewed in conjunction with their other stats, for even deeper understanding. Next week I’m excited to expand our list of advanced stats with a look at DVOA, and Next Gen Stats.
PLEASE SUBSCRIBE TO OUR CHEESEHEAD NATION WEEKLY NEWSLETTER HERE.
__________________________
Co-Owner of the thirteen time world champion Green Bay Packers. Sometimes I write about them. Follow me on Twitter at https://x.com/kjones_in_co and on Substack for film breakdowns!
__________________________










Comments (5)
Leatherhead
July 30, 2025 at 12:38 pm
I actually think it's about points. All of these manufactured metrics are essentially going to say that the best offenses score the most points, and the best defenses give up the fewest. After all is said and done, it always comes down to that. And on that pretty picture in the article, which team most closely resembles Philadelphia?
Guam
July 30, 2025 at 01:35 pm
Metrics have their place but they can also be damaging if carried too far. I always thought McCarthy and Rodgers got stuck on "big chunk plays" as a critical metric and sometimes forgot to just move the chains. Too many long bombs at the expense of open receivers underneath that could have kept the drive alive with a first down. That was a metric turned into an offensive philosophy and I thought it was a detriment to the Packer offense.
BuckyBadger
July 30, 2025 at 03:10 pm
I love pouring over stats and analytics and I liked this article because it discussed the limitations of these analytics as well. Nothing tells the full story and there will never be a perfect way to predict outcomes but things have come a lot further than points and yards. I agree the PFF score which so many take as gospel has its issues. The grading doesn't really take into the account the level of the opponent and it is subjective at times. I do like success rates and ability to conduct methodical drives are great ways to look deeper at an offense. Are they scoring because of luck or are they driving the field consistently and what quality of opponent did they do that against.
I handicap games as a hobby and understand nothing is perfect but I am always looking for better ways to analyze match ups.
GregC
July 31, 2025 at 06:43 am
"There’s no secret mathematical formula and no subjective views. Nothing but cold, hard yardage and first downs, baby."
Okay, the math is simple. What's subjective is the assertion that success rate is all that meaningful to begin with.
When I looked for information about PFF's methodology, I ended up with more questions than I started with. I think they basically know what they are doing, but I'm not even sure of that. Their stats have flooded football writing to the point that they are inescapable, but I don't think they are as accurate as they are portrayed to be.
Bearmeat
July 31, 2025 at 11:15 am
Even though PFF and other analytics sites tend to rate the Packers players lower than they are by their peers, on the aggregate, the Packers were clearly looked as elite. Yes. Better than the Lions and Vikings. And yet, going into this year, the Packers are looked at as “good not great” Maybe, just maybe, their hypocrisy is showing? 🤔